
As a leading Apple Search Ads campaign management platform, SearchAds.com has the most essential and advanced features to make your campaigns a success.

As a leading Apple Search Ads campaign management platform, SearchAds.com has the most essential and advanced features to make your campaigns a success. Yet, we have realized that some user acquisition managers use different metrics from the ones we have on our platform and even would like to create their own formula to track the metrics that matter.
To save our users from the pain of manually calculating these metrics on a spreadsheet, we have released a brand new feature: Custom Columns!
Custom Columns enable you to enter your own formula based on the metrics from Apple Search Ads and your MMP on SearchAds.com’s dashboard. Once you save your own formula, it will appear as a separate column on the Ads Manager and the values there will be shown according to your preset formula.
If you’re an Apple Search Ads manager who:
Custom Column feature is made for you.
To show you how this feature works, suppose that you are trying to figure out how much you pay per the users who actually download and open your app through Apple Search Ads.
Attribution Install data coming from your MMP shows you who has downloaded and opened your app whereas the download data from Apple Search Ads (LAT On and Off installs) tell you who downloaded your app regardless of them opening it. As the two data points will show you different results, the discrepancy is unavoidable. Add to that the discrepancies stem from LAT On users, things can get quite messy.
So if that’s the case, how will you calculate a more accurate cost per install metric? The most common way to tackle this issue is to come up with some custom formulas to get an approximation and better estimations. Let’s create one, using Custom Columns.
As we all know, attribution installs only include the installs coming from LAT Off users. But you may have realized that there is always a difference between LAT Off install data from Apple Search Ads and attribution installs from MMP because of the difference we mentioned above.
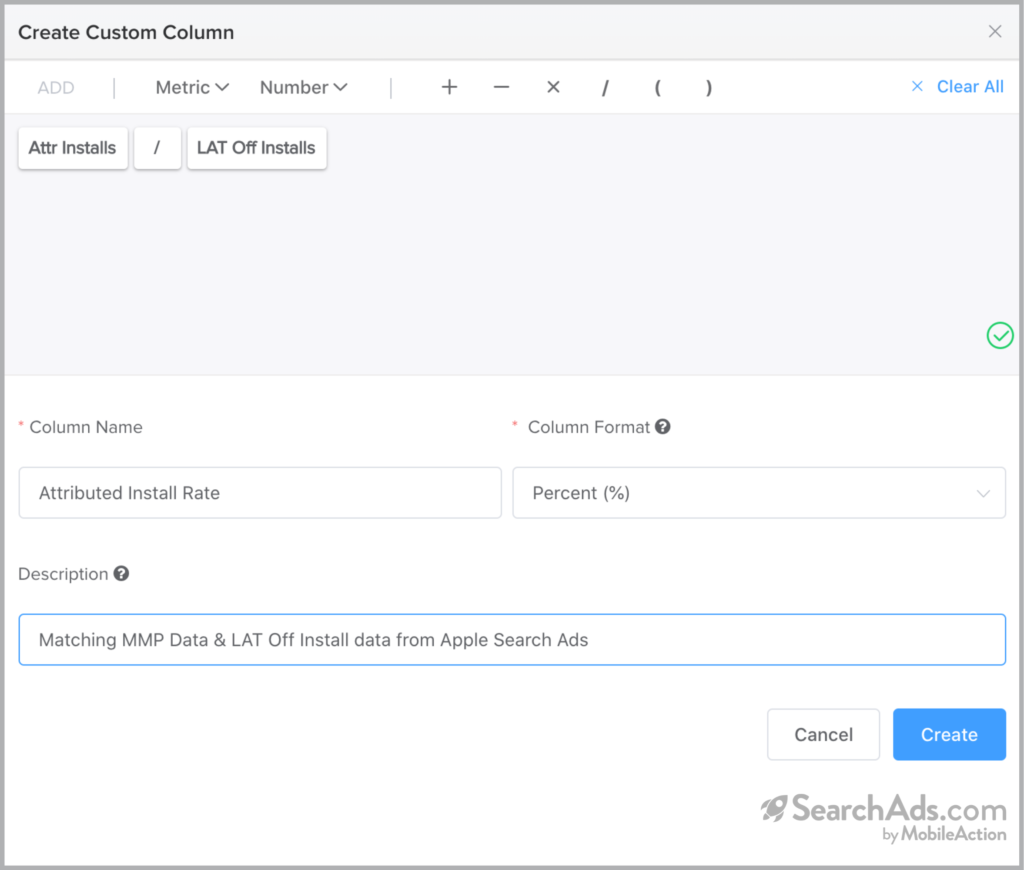
So, our first step to find out the real CPI is to determine the percentage of attributed installs out of all the LAT Off installs. Let’s call it: Attributed Install Rate.
Attributed Install Rate = Attributed Installs / Lat Off Installs
So, what does it mean actually? Let’s put it in a simpler way to make it more clear for all of us:
Attributed Install Rate = LAT Off users who opened my app after downloading it / LAT Off users who downloaded my app
This formula gives us a match rate that we can use when we try to estimate our LAT On Installs. We’ll come to the LAT On issues in a moment, but let’s first see how we can create this formula in the Ads Manager on SearchAds.com.
How to set up a custom column
Go to Ads Manager and click on “Edit Columns”. In the pop-up, click on “+ New Custom Column” and create your formula, choosing the related metrics and mathematical symbols. Select the column format (we chose percent % in our example) and type the name. We recommend that you type the purpose of your custom column as a description for your future reference. Lastly, hit “Create” and you’re all set!
Now that we have a match rate on hand, let’s get down to the LAT On part and try to make an estimation for the total installs.
All apps are supposed to have a revenue model, so the install metric is at the top of the funnel. But does higher install always means higher revenue?
If you have an app that requires one-time payment when users download it from the App Store, then regardless of those users opening your app, your total installs from Apple Search Ads will be equal to the install data from your MMP. That also means life is easy for you as you won’t have to deal with discrepancies related to installs from different data points.
However, most app publishers utilize far more complicated revenue structures and different in-app events to make a profit. This is where one starts to get worried about how to estimate the total installs and how to handle those mysterious LAT On users.
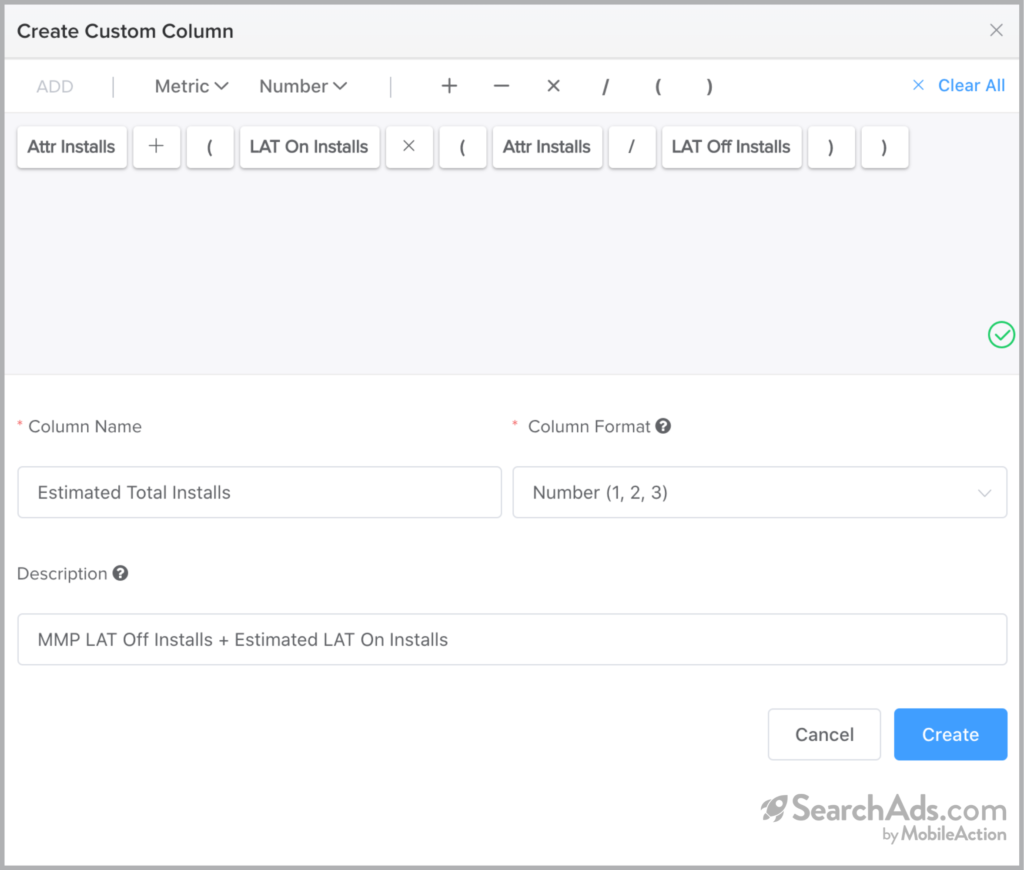
Using Attributed Install rate that we set in the previous section, let’s craft a formula for the total installs:
Estimated Total Installs = Attributed Installs + (LAT On Installs x (Attributed Installs / LAT Off Installs))
You will immediately recognize that the formula in the most inner parentheses is the Attributed Install rate. The reason why we multiply that rate with the LAT On Installs is that we simply try to estimate the number of LAT On users who opened the app by using a direct proportion method.
Once we get your estimated LAT On Installs, we just add the attributed installs to that to find the total estimations. The reason why we add the attributed installs directly is we know that that number comes from the MMP and shows the number of LAT Off users who opened our app.
This is how it will look when we form the above formula in the custom column feature:
As we have everything we need now, let’s take this to the next level and see what is our real cost per install.
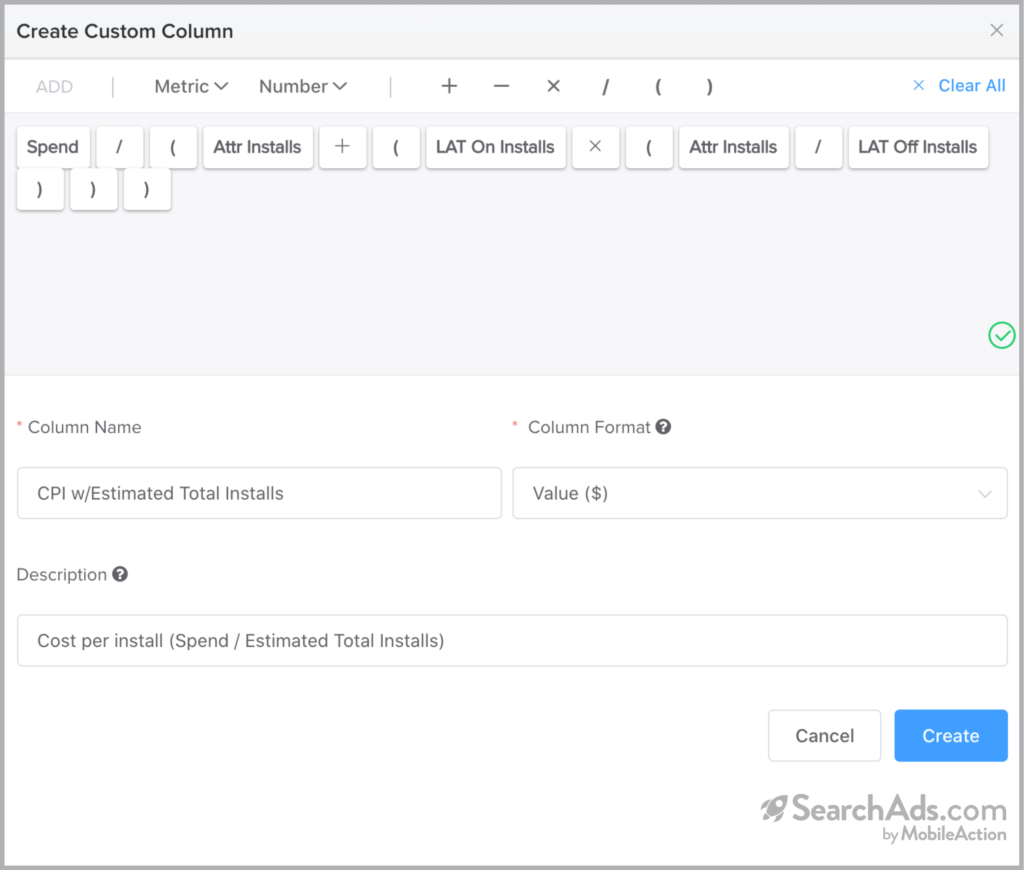
Based on the formulas in the previous steps, we will calculate our real cost per install and add it as a custom column. Before we move on though, let’s remember the generic formula of CPI:
Cost per install = Spend / Total Installs
Remember that the Total Installs part in the above formula is the one we calculated in the previous step. So adding the “Spend” metric in the equation we get the below formula to find our real CPI:
CPI = Spend / (Attributed Installs + (LAT On Installs x (Attributed Installs / LAT Off Installs)))
As our total installs will be based on estimated LAT On installs + MMP LAT Off installs, the above formula will tell us how much we spend for every user who downloads and opens our app.
So, rather than just taking into account the downloads or LAT Off installs, this would give us a better indication of our campaign performance in Apple Search Ads.
Please note that the formulas above are just some best practices and they are subject to change based on the characteristics of every app. They may or may not apply to your app, and as the Apple Search Ads Manager, you will know best which formulas or coefficients you should use to come up with your own KPIs.
With the Custom Columns feature of SearchAds.com, you will be able to tailor all the metrics coming from Apple Search Ads and MMP and save hours in your campaign management efforts. No more dealing with all those nerve-wracking calculations to prepare reports! Enter your formula once using Custom Columns and monitor your campaign performance with your customized metrics. The best part is that you can even use your custom columns in your automation rules to take things a step further!
Discover how one of our valued partners, Remake reduced their operation time and saved hours, using the features of SearchAds.com.
Interested in finding out what you can do more with SearchAds.com? As an official Apple Search Ads Partner, we would love to chat with you about your Apple Search Ads efforts and show you how you can optimize the whole campaign management process in a few simple steps! Schedule a demo with us to start scaling your campaigns in the most hassle-free way!


